> For the complete documentation index, see [llms.txt](https://nikhilc52.gitbook.io/making-animated-visualizations-in-r/llms.txt). Markdown versions of documentation pages are available by appending `.md` to page URLs; this page is available as [Markdown](https://nikhilc52.gitbook.io/making-animated-visualizations-in-r/introduction-to-animation.md).

# Introduction to Animation

Making static graphs and charts is a common skill for R programmers, but learning how to create animated moves and interactive plots requires more knowledge and work.&#x20;

Animations are also becoming more needed as research communication and outreach moves towards more digital mediums.

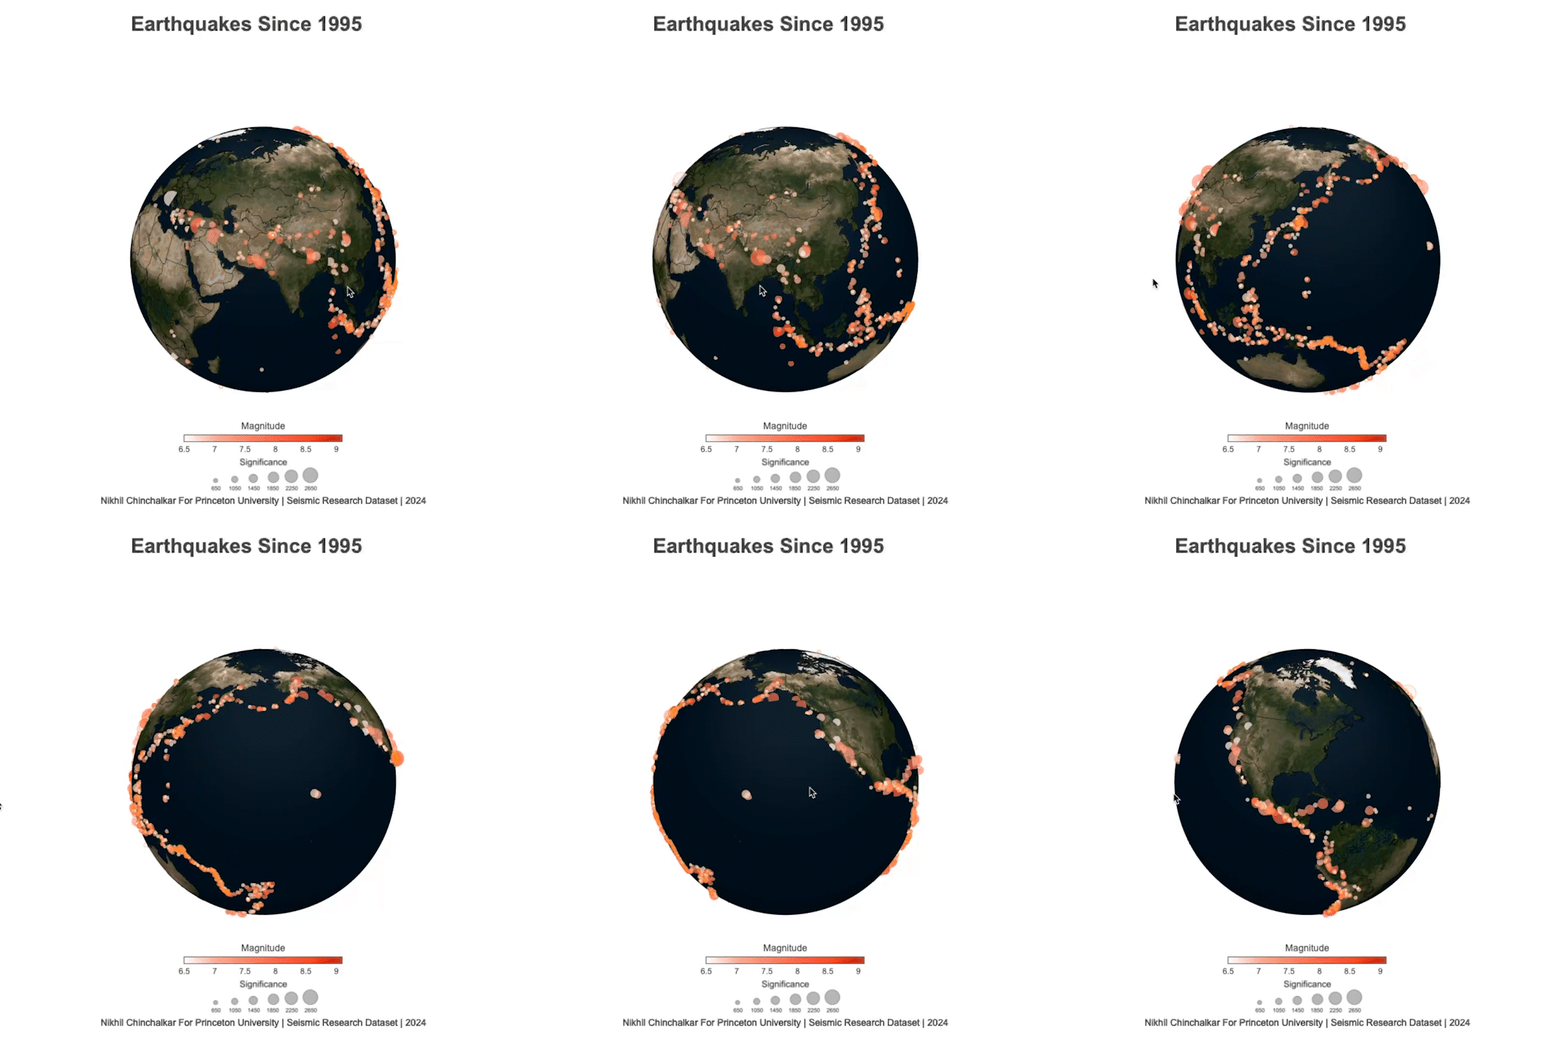
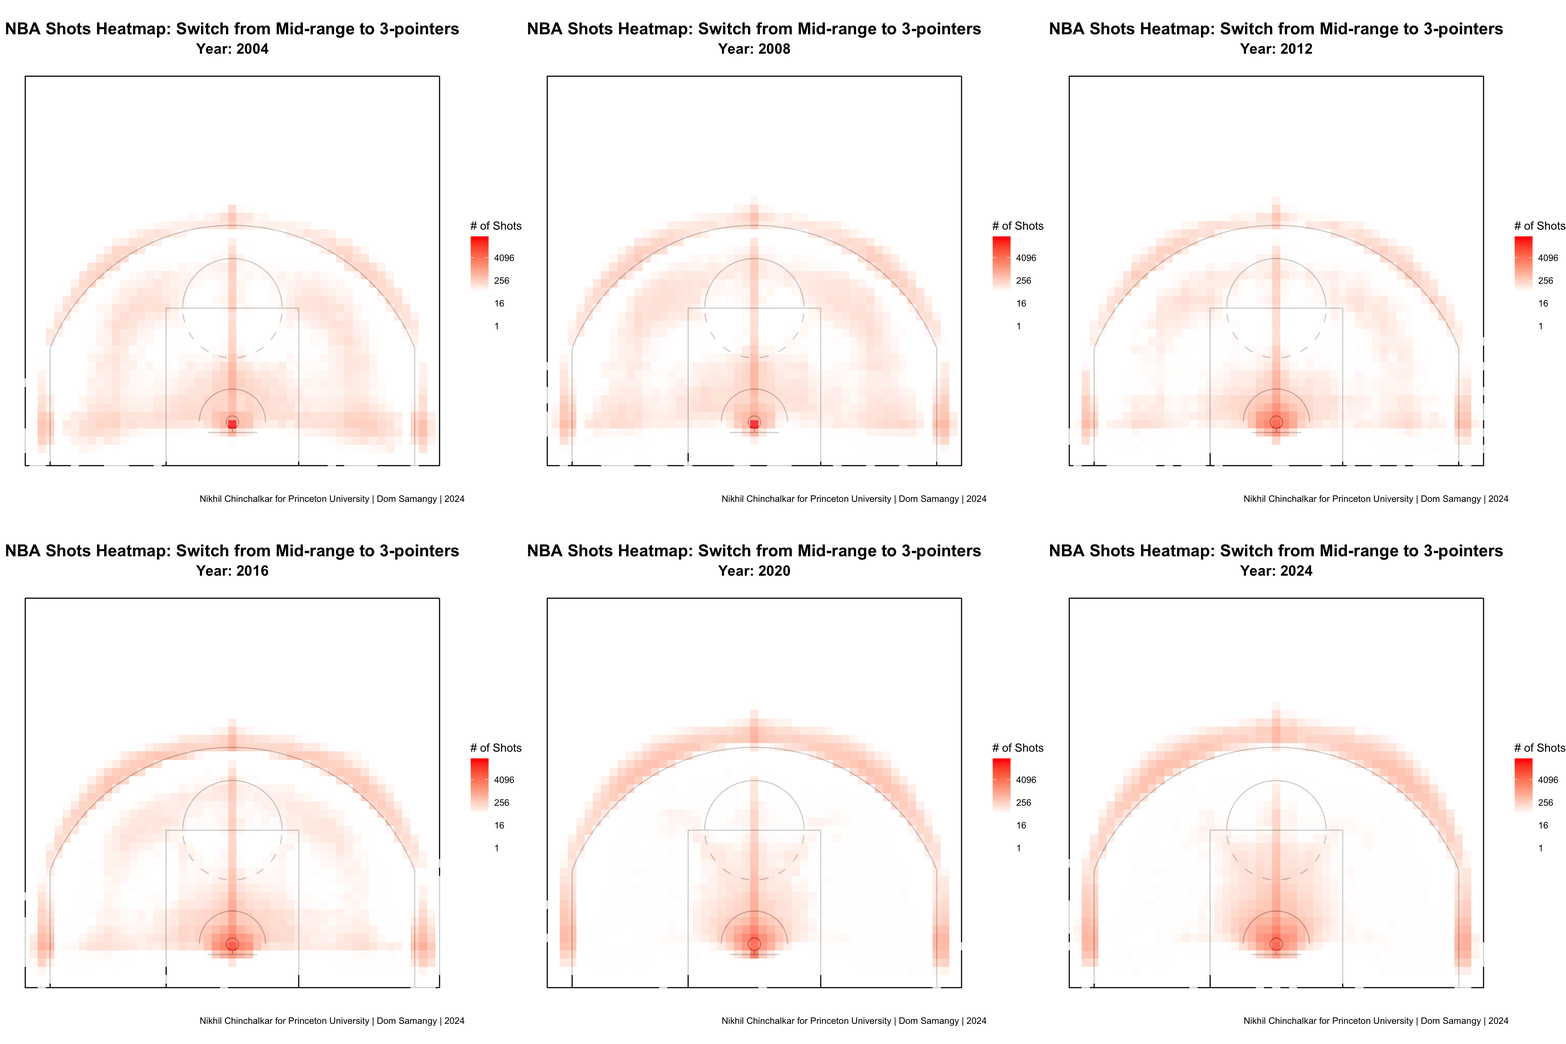
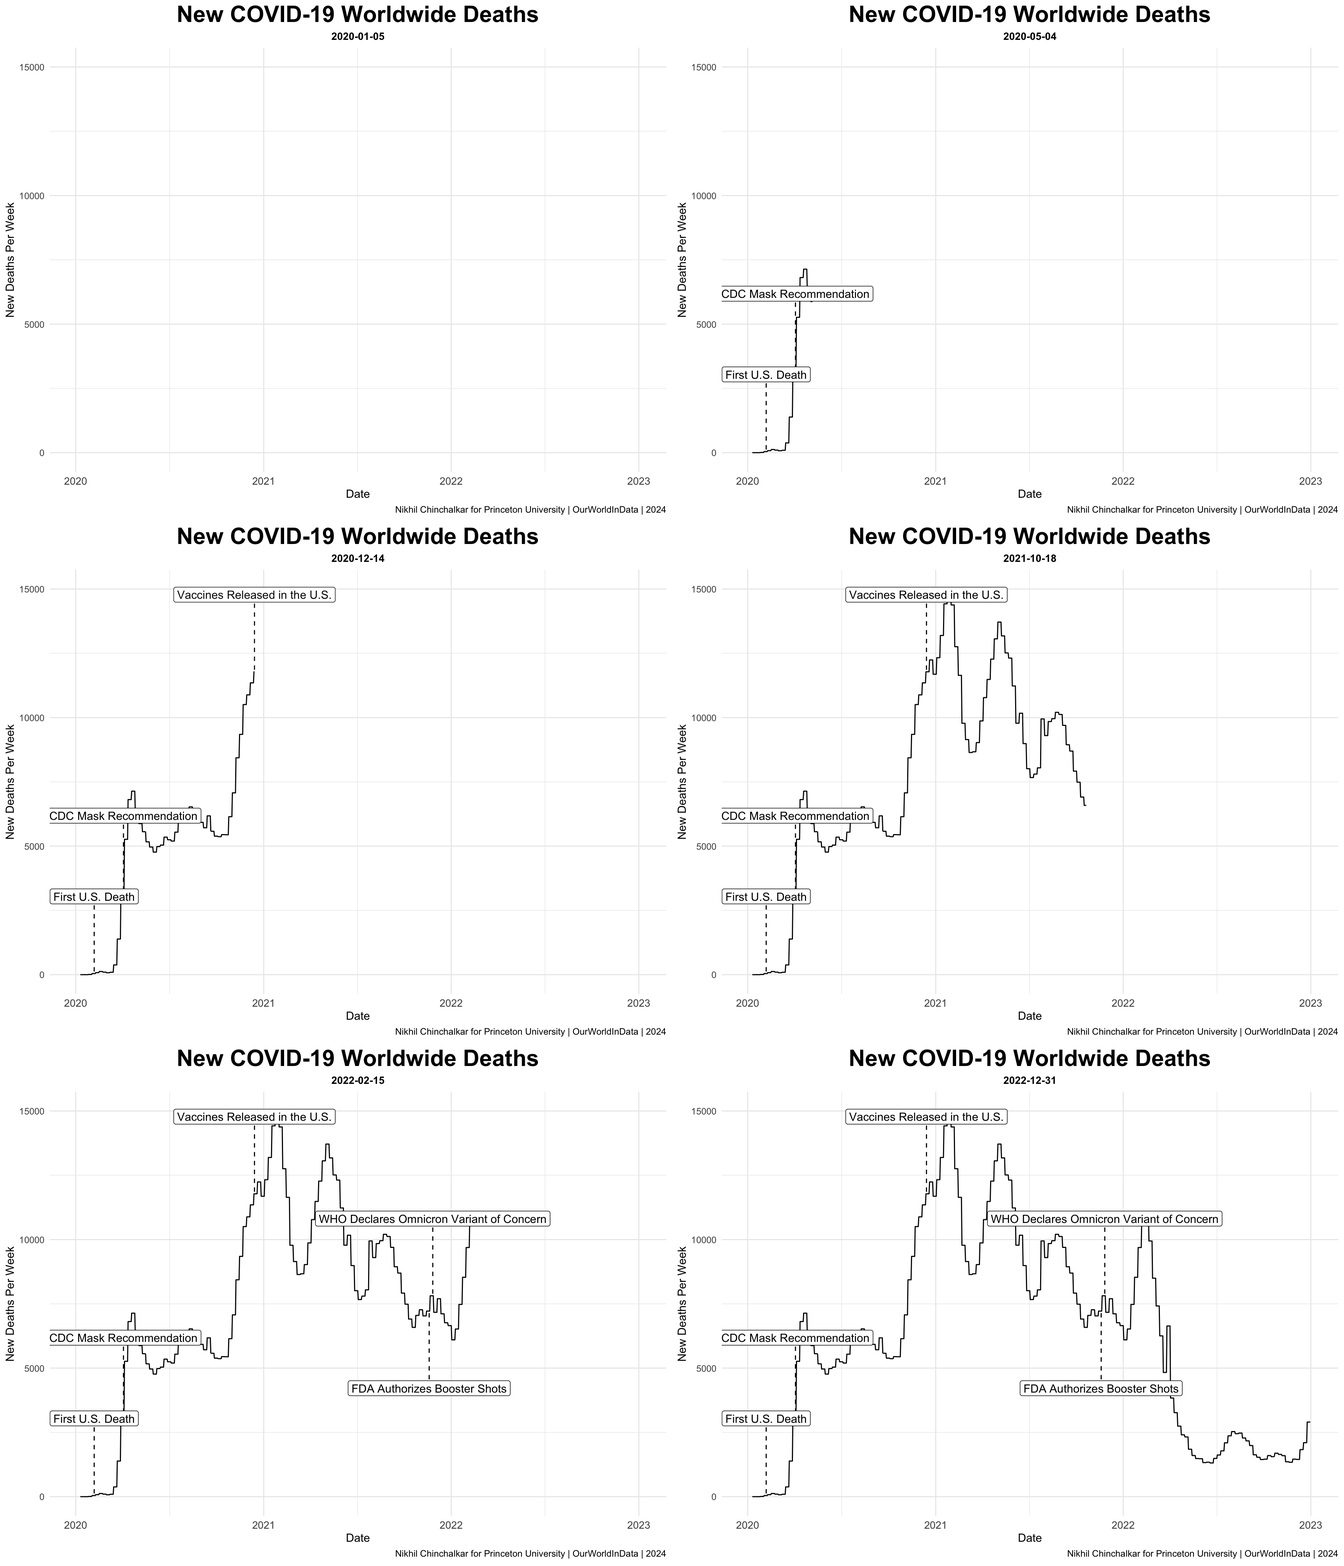
Below are some of the charts that are possible to make exclusively within the R environment:
<div data-full-width="true"><figure><img src="/files/7RkZqLQfgc8uLdYfwDRw" alt="" width="563"><figcaption></figcaption></figure> <figure><img src="/files/O426PDB7DhEyghQc83ez" alt="" width="563"><figcaption></figcaption></figure></div>

<div data-full-width="true"><figure><img src="/files/aYStP16dBpQiYOgvO3Xa" alt=""><figcaption></figcaption></figure> <figure><img src="/files/5Xakp7ahBVtTdvDM2RYZ" alt=""><figcaption></figcaption></figure></div>

<div data-full-width="true"><figure><img src="/files/K3aSBNo0XgEZqU5VTbKZ" alt=""><figcaption></figcaption></figure> <figure><img src="/files/913buxPk7IXBHEBaJyMA" alt=""><figcaption></figcaption></figure></div>

<div data-full-width="true"><figure><img src="/files/RxNoVfjpU2yAPLC0H6e5" alt=""><figcaption></figcaption></figure></div>

<div data-full-width="true"><figure><img src="/files/FAX7TwQxxdfhl29GwIYt" alt=""><figcaption></figcaption></figure> <figure><img src="/files/FLuCSgceij483O0htTZZ" alt=""><figcaption></figcaption></figure></div>